
Hotter Blocks, Older Maps: Redlining, Tree Canopy and Urban Heat
In the late 1930s, appraisers working for the federal Home Owners' Loan Corporation drew color-coded maps of more than 200 American cities. Green meant "best," blue "still desirable," yellow "definitely declining." Red meant "hazardous," and the appraisers' notes make clear that the presence of Black residents and some immigrant groups was often enough to earn that grade. The maps helped shape decades of lending decisions, and the practice they came to symbolize is now known as redlining.
Eighty years later, three researchers laid those maps over satellite images taken on hot summer days. Jeremy Hoffman, Vivek Shandas and Nicholas Pendleton published the results in 2020 in the journal Climate, covering 108 urban areas in the United States. Across those cities, neighborhoods the old maps graded "hazardous" were on average about 2.6°C (4.7°F) hotter in summer land-surface temperature than the non-redlined neighborhoods around them. In some cities the gap was considerably larger. The redlined areas also tended to have less tree canopy and more pavement.
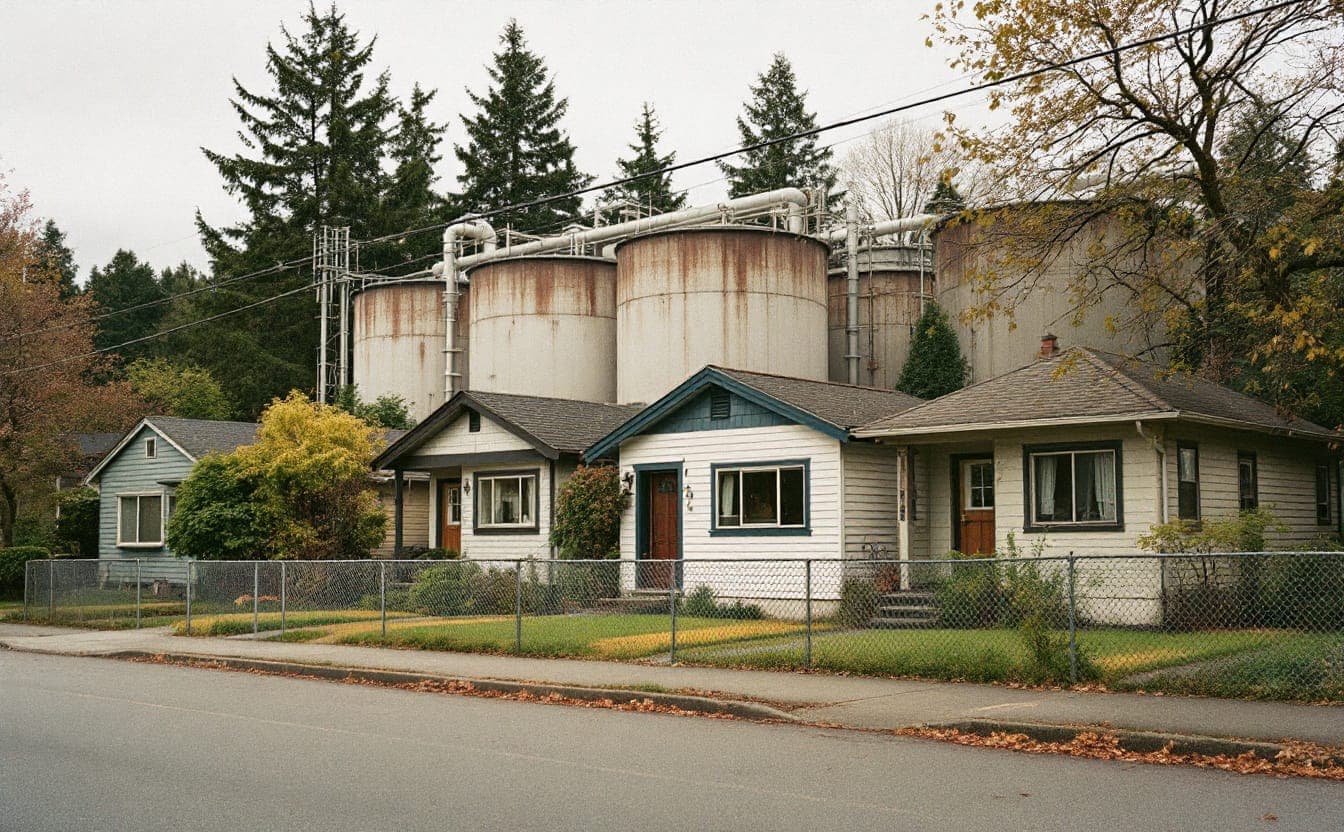
The study did not show that a 1930s map heats a street today. What it captured is the long tail of disinvestment: fewer street trees planted and maintained, more highways and industrial zoning, larger parking lots, fewer parks. Those choices piled up in the same places, and they show up as heat.
How to read an urban heat map
Heat maps have become a common sight in city climate plans and news coverage, and they are easy to misread. A few things to check before drawing conclusions.
Is it land-surface temperature or air temperature? Most citywide maps, including the ones in the 2020 study, use land-surface temperature measured by satellites. That is how hot the surface itself is: roofs, roads, parking lots, lawns, tree crowns. Dark asphalt in full sun can be far hotter to the touch than the air above it, so these maps show dramatic contrasts. Air temperature, which is what your body mostly feels along with humidity, varies less from block to block, but even a few degrees of difference in air temperature matters for health.
When was the image taken? A satellite captures one moment, usually in daytime. It says little about nighttime, when cities release stored heat and when bodies most need to recover. A neighborhood that cools off after dark is in a very different situation from one where the bricks and pavement keep radiating heat until morning.
Is the scale absolute or relative? Some maps color each area by how much hotter it is than the city average. Others show actual degrees. A dark red patch might mean "much hotter than the rest of town" or "a couple of degrees warmer." Read the legend before you read the colors.
Who lives there? Heat exposure becomes a health problem depending on people and buildings: older residents living alone, households without working air conditioning, top-floor apartments, outdoor workers, people experiencing homelessness. A heat map is the first layer, not the whole story.
Community heat-mapping campaigns
Since the late 2010s, cities have run community campaigns to fill the air-temperature gap, many supported by NOAA and run with CAPA Strategies, a firm Shandas founded. On one of the hottest days of summer, volunteers attach small sensors to their cars or bikes and travel set routes in the morning, afternoon and evening, recording air temperature and humidity as they go. The data produce block-by-block maps of air temperature and heat index at different times of day.
These campaigns have two benefits. The data are better suited to health planning than satellite snapshots, and the volunteers, often residents of the hottest neighborhoods, end up knowing their city's heat better than most officials do. That knowledge carries into public meetings.
What neighborhoods are doing
Trees, with money to keep them alive
Planting trees is the most visible response and one of the most effective over time. Shade cools pavement and people, and trees release water vapor that cools the air around them. The catch is that planting is the cheap part. Young street trees typically need regular watering for their first few years, plus pruning and protection from damage, and a program that plants thousands of saplings without a maintenance budget can lose many of them in the first drought.
The better programs budget for care from the start, hire local residents as tree stewards, and let neighbors choose species and locations. Engagement matters for another reason. Residents of disinvested neighborhoods sometimes turn down free trees, citing leaves to rake, roots that crack sidewalks they'll be billed to repair, or past city projects that never followed through. Those concerns are reasonable, and programs that answer them (by covering sidewalk repairs, for example) tend to plant more trees that survive. The nonprofit American Forests publishes a Tree Equity Score that compares canopy with population characteristics at the neighborhood level, a useful starting point for deciding where to focus.
Cooling centers people will actually use
Most cities open cooling centers during heat waves, often in libraries and recreation centers. Usage is frequently low. Common barriers include hours that end before the evening heat, sites that are hard to reach without a car, rules against pets, worries about ID checks, and simply not knowing the center exists. Some neighborhoods are experimenting with "resilience hubs," trusted community buildings that offer cooling, charging, water and information year-round, so people already know the way when a heat emergency arrives.
Cool roofs and cool surfaces
Reflective roof coatings and lighter-colored roofing materials bounce more sunlight back, lowering roof surface temperatures and the heat that reaches the rooms below. That matters most for top-floor apartments and single-story homes without air conditioning. Some cities require cool roofs on new construction or major re-roofing. For renters, the most practical step is often a tenant association asking a landlord to apply a reflective coating at the next scheduled roof repair.
Shade where people wait
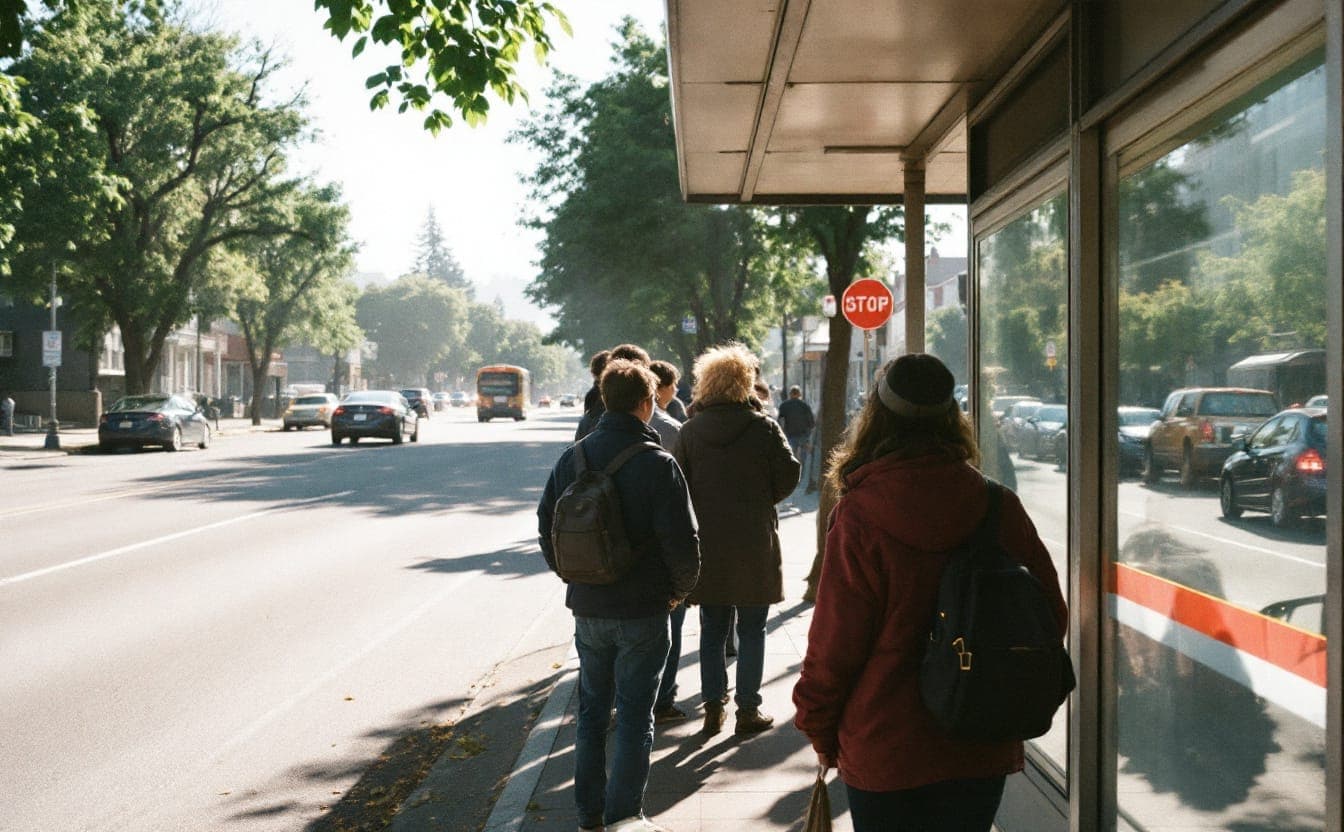
Bus riders in hot cities often stand in full sun for long stretches. Phoenix, which in 2021 created the first publicly funded city office dedicated to heat response and mitigation, has invested in shade structures and trees at transit stops. Los Angeles took a lot of public criticism in 2023 for a narrow pilot shade design at bus stops, which showed how much people care about getting this right. Good shade is wide, oriented to the afternoon sun, and paired with seating and water where possible.
Before you go
 GoveeLife H5106 PM2.5 monitor$45.99 Amazon price, as of Oct 22, 2026, 4:26 PM UTCSee on Amazon
 TP50 indoor thermometer and hygrometer$10.49 Amazon price, as of Oct 22, 2026, 4:26 PM UTCSee on Amazon
 3M Aura N95 respirators, 20 pack$34.59 Amazon price, as of Oct 22, 2026, 4:26 PM UTCSee on Amazon
Product prices and availability are accurate as of the date/time indicated and are subject to change.
Gear links may earn us a commission. As an Amazon Associate I earn from qualifying purchases.
The health stakes
The National Weather Service counts heat as the leading weather-related cause of death in the United States, ahead of floods and hurricanes. Maricopa County, Arizona, which includes Phoenix, recorded more than 600 heat-associated deaths in 2023. A large share of those who died were people experiencing homelessness, and many indoor deaths involved air conditioning that was missing or not working.
Heat also causes harm far short of death. It strains the heart and kidneys, worsens asthma and other lung conditions, and is linked to more emergency room visits. Some common medications, including certain diuretics and psychiatric drugs, make it harder for the body to regulate temperature. Older adults, young children, pregnant people, outdoor workers and people with chronic illness face the highest risks. Hot nights are especially dangerous because the body never gets a chance to recover.
For anyone who works in public health or environmental justice, heat is a useful lens because it connects housing, transportation, labor and land use in one measurable outcome. The landmark reports we cover show how earlier generations of researchers turned similar patterns of unequal exposure into evidence, and our profiles of influential figures include several who spent careers on exactly these questions.
Federal support for heat and environmental justice work changed considerably in 2025, and some programs that cities relied on were cut or scaled back. Much of the practical work described here has always been local, though, and plenty of it continues through cities, counties, universities and neighborhood groups.
Frequently asked questions
Does redlining directly cause today's heat differences? Not in a simple sense. The maps reflected and reinforced decisions about lending, investment and land use, and those decisions shaped where trees, parks, highways and industrial sites ended up. The 2020 study documents the association across many cities. The mechanism runs through decades of choices that followed.
Why do some maps show differences of 10 or 20 degrees across a city? Usually because they show land-surface temperature, which varies much more than air temperature. A sunny parking lot and a shaded lawn can differ enormously at the surface. Air temperature differences are smaller but still large enough to affect health.
Will planting trees raise rents? It can contribute, especially when greening is paired with other large investments. That is a reason to pair canopy programs with tenant protections and resident decision-making, not a reason to leave hot neighborhoods without shade.
Is a fan enough on a hot night? Not always. Federal health guidance has long warned that electric fans may provide comfort but will not prevent heat illness once temperatures reach the high 90s Fahrenheit. Cool showers, staying hydrated, checking on neighbors and getting to an air-conditioned space for part of the day all help.
Where can I see my neighborhood's redlining map? The Mapping Inequality project at the University of Richmond has digitized the HOLC maps and the appraisers' notes, searchable by city: dsl.richmond.edu/panorama/redlining. For daily heat forecasts and warnings, check your local office of the National Weather Service.
How can a nonprofit get involved? Join or propose a local heat-mapping campaign, help run tree-care volunteer days, or partner with a tenants' group on cool-roof requests. Several groups in our organization profiles work on widening access to parks and green space, which overlaps directly with cooling.
Gear links may earn us a commission. As an Amazon Associate I earn from qualifying purchases.
Pack list
- TP50 indoor thermometer and hygrometerReads temperature and humidity, the two numbers the heat index needs.$10.49 Amazon price, as of Oct 22, 2026, 4:26 PM UTCSee on Amazon
- 3M Aura N95 respirators, 20 pack 20 masksNIOSH-approved N95s that fold flat; the kind of mask that filters smoke particles.$34.59 Amazon price, as of Oct 22, 2026, 4:26 PM UTCSee on Amazon
- The Color of Law, by Richard RothsteinHow public policy segregated American neighborhoods, the backdrop to many of today's heat and pollution maps.$8.54 Amazon price, as of Oct 22, 2026, 4:26 PM UTCSee on Amazon
Product prices and availability are accurate as of the date/time indicated and are subject to change.
Next: try the AQI Calculator or browse the full Pack list.