



Toxic Wastes and Race: How One Report Taught a Movement to Count
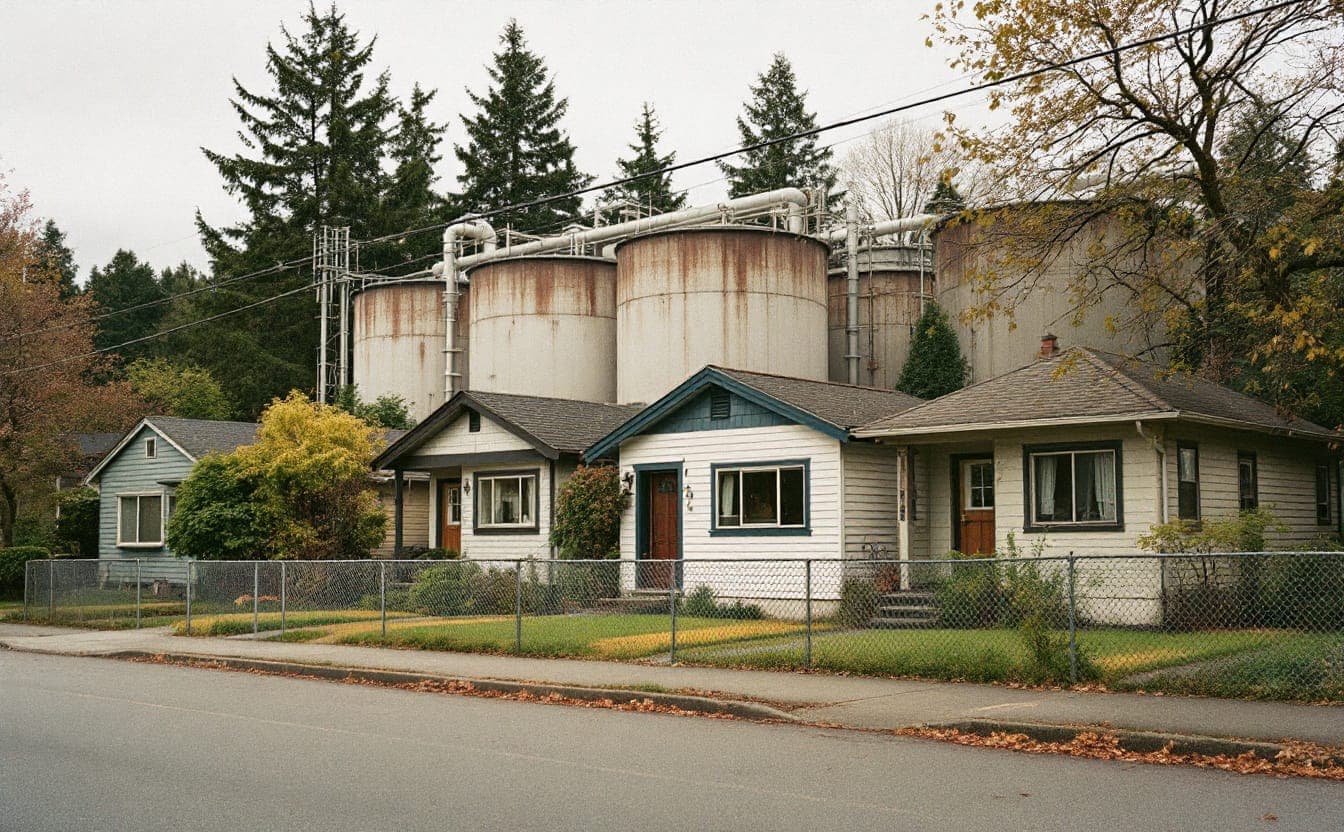
In September 1982, residents of Warren County, North Carolina, lay down on a country road to stop dump trucks hauling soil laced with PCBs to a new state landfill. Over the following weeks more than 500 people were arrested. The landfill opened anyway. Warren County was majority Black and one of the poorest counties in the state, and the protesters said plainly what they believed: the site had been picked because of who lived near it.
Belief is not evidence, and the people who went to jail in Warren County understood that their argument would be won or lost on numbers. Over the next 25 years, a loose network of church activists, sociologists and neighborhood leaders built its case on careful counting, argued in public about how to count better, and kept its methods open for anyone to check. Two reports sit at the center of that story. Both are still worth reading closely, especially if your work involves maps, data or a community that suspects it is carrying more than its share.
From one county to a national question
Walter Fauntroy, the District of Columbia's delegate to Congress, was among those arrested in Warren County. Afterward he asked the General Accounting Office (now the Government Accountability Office) to look at how hazardous waste landfills had been sited in the Southeast. The GAO's 1983 study examined the four offsite hazardous waste landfills in EPA's Region 4, which covers eight southeastern states, and found that three of them sat in communities where Black residents were the majority.
The result was striking, but it covered four sites in one region. The Commission for Racial Justice, the racial justice arm of the United Church of Christ, had been involved in Warren County from the start, and it set out to ask the question for the whole country. Benjamin Chavis led the commission. Charles Lee directed the research. The result, published in 1987, was Toxic Wastes and Race in the United States: A National Report on the Racial and Socio-Economic Characteristics of Communities with Hazardous Waste Sites.
What the 1987 report found
The study had two parts, and it helps to keep them separate.
The first looked at commercial hazardous waste facilities, the operating businesses that treat, store or dispose of hazardous waste. The researchers compared residential ZIP codes that hosted these facilities with ZIP codes that did not, and tested several community characteristics at once, including racial composition, household income and home values. Race came out as the most significant of the variables they tested. Communities with the greatest number of commercial facilities also had the highest proportion of residents of color.
The second part looked at uncontrolled toxic waste sites: closed or abandoned sites that EPA had identified as potentially hazardous. Here the headline was about exposure across whole populations. The report estimated that about three out of every five Black and Hispanic Americans lived in communities with one or more of these sites.
Chavis is widely credited with popularizing the phrase "environmental racism" around this time, and the report gave the phrase something solid to stand on. Our explainer on landmark reports walks through the document's structure and its recommendations in more detail.
Before you go
 The Color of Law, by Richard Rothstein$8.54 Amazon price, as of Oct 22, 2026, 4:26 PM UTCSee on Amazon
 Levoit Core 300 air purifier$89.99 Amazon price, as of Oct 22, 2026, 4:26 PM UTCSee on Amazon
 GoveeLife H5106 PM2.5 monitor$45.99 Amazon price, as of Oct 22, 2026, 4:26 PM UTCSee on Amazon
Product prices and availability are accurate as of the date/time indicated and are subject to change.
Gear links may earn us a commission. As an Amazon Associate I earn from qualifying purchases.
Why the method mattered
Before 1987, anyone defending a particular siting decision could treat each case as local. The land was cheap, the zoning allowed it, the county wanted the tax revenue. Each explanation might be true on its own terms, and none of them required talking about race.
The national analysis changed the terms of that argument. By testing race alongside income and property values, the commission went straight at the strongest counterclaim: that hazardous facilities follow cheap land and poverty, and race only shows up in the data because it travels with income. In the 1987 analysis, race still stood out with those economic factors in the picture. The report did not claim that anyone had sat in a room and chosen Black neighborhoods on purpose. It showed a national pattern strong enough that intent became a secondary question.
The method also had limits, and the movement's credibility grew partly because those limits were debated in the open. ZIP codes are large and irregular. A facility near the edge of one ZIP code can sit closer to the families across the boundary than to the ones inside it, yet only the host ZIP code counts as exposed. Researchers call this approach unit-hazard coincidence: you ask whether a hazard falls inside a geographic unit, then compare units that have one with units that don't. During the 1990s, some studies using smaller census tracts reported weaker or less consistent national disparities. Others raised a fair question about sequence. Did facilities come to communities of color, or did low housing costs near existing facilities draw lower-income residents of color afterward?
Both questions deserved answers. The field's response was better methods, not louder press releases.
Twenty years on: drawing circles instead of boxes
In 2007 the church's Justice and Witness Ministries released Toxic Wastes and Race at Twenty: 1987-2007. The authors were Robert D. Bullard, Paul Mohai, Robin Saha and Beverly Wright, researchers who had each spent years on these questions. (Bullard's own path, from a 1979 study of waste sites in Houston to the books that defined the field, is sketched in our profiles of influential figures.)
Instead of asking which ZIP code or tract a facility sat in, the 2007 team used distance-based methods with 2000 census data. They drew circles of set distances around each commercial hazardous waste facility and estimated how many people, and which people, lived inside each circle, apportioning the census units that a circle only partly covered. That fixes the edge problem. A family 500 meters from a facility counts as a neighbor whether or not a boundary line happens to run between them.
The results were sharper than in 1987. People of color made up 56 percent of residents living within three kilometers of the nation's commercial hazardous waste facilities, compared with 30 percent in areas farther away. Where facilities were clustered together, people of color made up more than two-thirds of nearby residents. Poverty rates were higher in host neighborhoods, but racial disparities persisted after income was taken into account. The authors concluded that the disparities were greater than earlier studies had reported, and they attributed much of the difference to the improved method.
That last point is the lesson for anyone who works with environmental data. The same facilities and the same population can produce a modest disparity or a large one depending on how you define "nearby." Neither number is automatically the honest one. The honest move is to say which method you used, why you chose it, and what changes if you use another.
The summit that turned findings into principles
Between the two reports, the movement changed shape. In 1990 the Southwest Organizing Project and allied activists sent a letter to several of the largest national environmental organizations, criticizing how few people of color worked on their staffs and boards and how little their agendas reflected communities of color. It put a question about environmental organizations themselves on the table next to the questions about landfills.
In October 1991, the Commission for Racial Justice convened the First National People of Color Environmental Leadership Summit in Washington, DC, with Charles Lee as a principal organizer. Delegates came from community groups across the country and from Native nations, and they adopted 17 Principles of Environmental Justice.
Reading the principles next to the 1987 report shows how far the conversation had widened. The report was about where waste went. The principles were about who decides. They demand the right to participate as equal partners at every level of decision-making, from needs assessment through enforcement and evaluation. They address workers' right to safe workplaces, the sovereignty and self-determination of Native peoples, informed consent in medical research, and education rooted in diverse cultural perspectives.
Moving a facility from a Black neighborhood to a poor white one would satisfy a narrow reading of the numbers. It would not satisfy the principles, which ask for an end to producing that kind of harm in the first place and for affected people to hold real power over the decisions.
Federal policy followed, slowly. EPA set up an Office of Environmental Equity in 1992, and in February 1994 President Clinton signed Executive Order 12898, directing federal agencies to identify and address disproportionately high and adverse environmental and health effects of their programs on minority and low-income populations.
How communities measure exposure now
The questions in both reports are still the questions. What has changed is who holds the tools for answering them.
Monitoring the air
Community air monitoring has a grassroots history. In the 1990s, residents living near refineries in California began using "bucket" samplers (a plastic bucket holding a sampling bag, filled with a small pump) to capture air during odor events and send it to a lab. The approach spread to Louisiana's petrochemical corridor through the Louisiana Bucket Brigade. Many groups now add inexpensive particulate sensors that report in near real time. They are good at revealing patterns, such as a spike every night at the same hour, though readings need checking against regulatory-grade monitors before anyone builds a legal case on them.
Regulation has caught up in places. A 2015 EPA rule requires petroleum refineries to monitor benzene at their fencelines. California's AB 617, passed in 2017, created a program in which selected communities work with air districts on local monitoring and emissions reduction plans, guided by steering committees that include residents.
Mapping cumulative burden
Screening tools combine pollution data with population characteristics to show where burdens pile up. CalEnviroScreen, first released by California in 2013, ranks census tracts by a combined score. EPA's EJScreen, public since 2015, lets anyone outline an area and see a set of environmental and demographic indicators for it. These tools descend directly from the 1987 logic of looking at many places at once, and they inherit its caveats. They show only what has been measured, their data lag behind current conditions, and their geography can hide a hot spot inside an unremarkable tract average. Groups that rely on a public tool should download and keep the underlying data for the places they care about, so their evidence doesn't depend on a website staying the same.
Asking people directly
Some of the most persuasive evidence comes from door-to-door health surveys run by residents, often with a university partner under a community-based participatory research agreement. A good survey can surface asthma clusters, missed school days or symptoms that follow plant flaring, things official data rarely capture at the block level. Surveys have limits too. Small samples make statistics fragile, and a careless survey can expose neighbors' private health information. Strong partnerships settle ahead of time who owns the data and how findings will be shared back with the people who gave them.
What the reports still ask of us
The 1987 report's most quoted finding fit in a single sentence. That simplicity carried it into Congress and newsrooms. It also made the report easy to attack, and its defenders answered by improving the work.
For an environmental organization today, that history suggests some durable habits. Publish your methods alongside your findings. Choose geographic units that match how people actually live, breathe and walk to school. Treat residents as co-authors of the evidence rather than as subjects of it, because they usually knew the answer long before the data confirmed it.
Both reports remain available through the United Church of Christ, and our annotated reading list points to the books and studies that grew out of them.
Gear links may earn us a commission. As an Amazon Associate I earn from qualifying purchases.
Pack list
- TP50 indoor thermometer and hygrometerReads temperature and humidity, the two numbers the heat index needs.$10.49 Amazon price, as of Oct 22, 2026, 4:26 PM UTCSee on Amazon
- 3M Aura N95 respirators, 20 pack 20 masksNIOSH-approved N95s that fold flat; the kind of mask that filters smoke particles.$34.59 Amazon price, as of Oct 22, 2026, 4:26 PM UTCSee on Amazon
- The Color of Law, by Richard RothsteinHow public policy segregated American neighborhoods, the backdrop to many of today's heat and pollution maps.$8.54 Amazon price, as of Oct 22, 2026, 4:26 PM UTCSee on Amazon
Product prices and availability are accurate as of the date/time indicated and are subject to change.
Next: try the AQI Calculator or browse the full Pack list.